G.S. Rajendram, J. Waller, C. Cameron, R. Longhurst, J. Luo, A. Ghani and M. O’Connor.
AgResearch, Ruakura Research Centre, East St, Private Bag 3123, Hamilton.
Abstract
Data from 1,272 nitrogen (N) fertiliser trials from around New Zealand over the last 80 years were collated onto an electronic database. Data collected included nitrogen (N) fertiliser forms, N application rates, plant dry matter (DM) yields, botanical composition, soil types and weather conditions (rainfall and air temperature). These data were sourced mostly from original trial records and reports. In this paper, a summary of the information gathered from the database and relationships between the first cut N response and climatic factors are presented.
Nitrogen response was calculated as the extra daily kg of plant DM produced per kg of N applied.
Most of the trials either used Nitrolime or Urea. A comparison of N responses between these two fertiliser products showed no significant overall difference.
Late spring application gave the greatest and most reliable response to N application. In general, only weak relationships between climatic factors and response to N were established. The strongest relationship was found to be between response and average daily air temperature for each soil, under near-ideal conditions (average daily rainfall ≥ 1 mm and soil deficit ≤ 20 mm) where basal fertiliser had been applied. The relationship between N response and rainfall was weaker than the relationship between N response and temperature.
An estimate of minimum average daily air temperature for an N response in spring was established as 5 0C and is consistent with overseas studies. This suggests that fertiliser should not be applied until the daily mean air temperature is > 5 0C.
However, using data currently available, no single relationship has explained pasture response to applied N fertiliser application; perhaps not surprisingly. Better correlations may have been established for N response if more soil moisture or N status data were available and basal fertiliser application included more frequently in trial design. Only a few trials had soil moisture and N status data. Many trials, approximately 50%, did not have basal fertiliser applied. If any major or trace elements did limit pasture growth, this may have affected the magnitude of N responses.
Some of the factors confirmed as influencing N response are temperature, soil type soil moisture and basal fertility. Therefore, a fertiliser decision support system needs to take into account at least these factors. This database represents a useful resource complementing future investigations.
Introduction
Nitrogen (N) fertiliser trials have been conducted in New Zealand over the past 80 years. The major organizations involved in N research have been MAF, MAFTech, and AgResearch. The DSIR also carried out several field trials on N during the 1970-80s. Approximately one-third of the N response trials conducted in NZ were carried out by O’Connor and his team at MAF between 1969-1975 (O’Connor, 1982). After MAFTech and the DSIR were disbanded, commercial fertiliser companies such as Ballance Agri-Nutrients and Ravensdown have provided the funding for most of the N research conducted since the mid-1990s until present, using technical expertise within the Crown Research Institutes and Universities to conduct trials.
There have been numerous publications on the use of N fertiliser to pastures in the form of booklets and short articles, such as ‘N fertiliser use on pastures and crops’ (Ledgard, 1990’s); AgFact (Crush et.al., 1994) and ‘Fertiliser use on NZ dairy and sheep and beef farms’ (Roberts et. al., 1993).
The findings from this study will help in part to develop ‘a decision support tree’. The purpose of the decision support tree is to ensure efficient N fertiliser use for desired environmental and production outcomes under New Zealand climate and soil conditions. The data obtained will also be useful for further improving the Overseer nutrient budget model.
Field trials conducted throughout New Zealand have generally used the experimental designs and procedures outlined by Lynch (1966). First, data from all these field trials were obtained, collated, and entered into an electronic database. Climatic data from the nearest meteorological station were also included to assist the interpretation of the results. Data were later selected and statistical analysis undertaken.
This paper presents information gained from the N trials and parameters used for setting up the database. The data were used to establish relationships between N response and climatic factors and a summary of this analysis is presented.
Much of the basic analysis was carried out in Excel, filtering the graphs according to various regimes:
No summer months were used in the analysis of the data, as there were concerns over potential issues with sward composition.
Trials where the control plot yields exceeded 5,000 kg DM/ha and where the days of growth did exceed 100 were excluded.
There was a range of fertiliser products used. This study will consider only Nitrolime and Urea, the most common products by far. A discussion of the difference between the two is presented in the discussion section.
Summaries of the regressions as well as the best models are provided in the Results and Discussion section. Note that these regressions are probably best described as ‘explanatory’ rather than ‘predictive’ models.
Data were restricted only to first cut response for this study. In this report, the 50 kg N/ha rate is used to calculate the daily kg DM produced per kg of N applied. The measure of response considered in this study is “unit N”, which is defined as: ‘the increase in rate of growth per unit N applied’.
Unit N = (Treatment Yield – Control Yield) / N Applied (kg) / Days of growth
Yields are expressed as kg dry matter (DM). N applied is expressed in kg.
Trials in the database did not always have a 50 kg N/ha rate. In order to include the vast majority of trials in the database for this report, application rates in the range 40-60 kg N applied were used. This requires that approximate linearity of the response be assumed over this range, a feature that appears reasonable after inspection of the data.
The measure of first cut DM response over 40 days is also calculated and presented as “unit N40”. This is the extra kg DM yield over and above control per unit N applied over 40 days growth.
Data Capture, Number of Trials, Duration of Trials and Treatments
The data captured represented trials conducted in different regions of the country over an 80-year period (1927 to 2007). For this paper, trials conducted after 1951 (56-year period) were used since meteorological data before this date were unavailable. The data were extracted from various sources, including the original trial paper files stored in archives and published reports or papers. Students under the supervision of AgResearch staff entered data into the database. All entered data were checked.
There were 1,272 trials. The 1970s and 1980s were the two decades in which most N trials were undertaken. Most of these were conducted during a six-year period 1969-1974. Most trials were of short duration, ranging from three to six months inclusive. A total of 405 trials for N response using Nitrolime were carried out by O’Connor and team at MAF.
All trials which included N treatments were considered. Approximately 86% of trials contained 2, 3, or 4 treatments. There was a range of fertiliser products used, but this report considered only Nitrolime (41% of trials) and Urea (39% of trials), the most common products used. In total, there were 32 different forms of nitrogen used in the trials conducted.
Meteorological Data (Rainfall and Air Temperature)
The meteorological data for a site were obtained from the nearest available meteorological station. Often, these stations were close to the trial site but sometimes they were distant. For a number of trials, they were greater than 30 km away. The results of the study must be interpreted considering the distance between the trial site and the metrological station.
Meteorological data for this study were obtained from the NIWA Climate Database. Rainfall and air temperature were obtained on a daily basis for each trial’s first individual cut plus the previous three months prior to trial commencement, which were summarised for each month.
For rainfall, average rainfall (mm/day), total rainfall days, start deficit and deficit difference (the difference between end and start deficit) were summarised. If the daily rainfall was greater than 0.99 mm, this day was identified as a rainfall day.
Air temperatures were summarised by taking an average of the daily minimum and maximum air temperature. There is limited soil temperature (10 cm depth) and soil moisture data; therefore air temperature and rainfall were used. The N database contains air temperature and rainfall data dating back to 1951.
Pasture Type and Growth Limiting data
Regions and Farm Types
The fertiliser N trials have been conducted throughout New Zealand. The majority of the trials were conducted in the North Island (65%).
All conventional farming types were used in the analysis. The proportion of fertiliser N trials conducted on different farm types was 49% on dairy farms, 28% on sheep farms, 3% on beef farms, 10% on mixed sheep/beef farms and 9% of trials were on farms where the type of farming was unknown.
For the N database, only the initial soil test was collated (soil tests just prior to trial commencement). Most trials undertook an initial soil test (0-7.5 cm depth) for pH, Ca, K and P. Measurements of the N status were only undertaken on a very small number of trials.
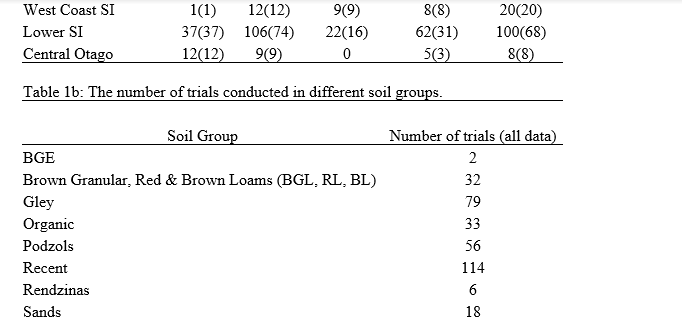
The soils were segregated into 28 soil groups, with 15 for the North Island and 13 for the South Island. The soil groupings were based on those used in the maintenance fertiliser model of Cornforth and Sinclair (1982).
Pastures respond to fertiliser when the grass is actively growing and when conditions such as water, temperature and light are favourable. Differences in these factors are responsible for differences in yield and response to N fertiliser during different seasons and from year to year (Whitehead, 1995). Differences in soil characteristics – such as N supply, temperature, and soil water – contribute to the dry matter yield and responses of pasture. Much of the variation encountered in DM response at sites to N fertiliser application involves interactions between soil and weather factors during the course of the year.
For this study, meteorological data for a site were obtained from the nearest available meteorological station. In many cases, these were not in close proximity to the trial sites. It is normal for experiments to be designed around a hypothesis of interest, and so trials established for one purpose are very often not optimal for other purposes. Since virtually all the trials in the database would have been established when environmental conditions were conducive to growth (so that a response was likely), the range of meteorological data and response are not going to be as wide as the potential extreme ranges. In many cases where trials were laid down under less-than-ideal conditions, the plots were often left to grow for an extended period of time. This is likely to be associated with greater variability in the data. It is also possible that areas known to be only weakly responsive to nitrogen were not considered when trials were laid down. There is minimal N status (soil mineral-N, mineralisable-N, organic-N or plant N) data available in the database.
General discussion of database data
Not all data within the database was used. Data from the database were selected only when all the following conditions were met, namely: growth not exceeding 5,000 kg DM/ha on control plots, days of growth not exceeding 100 days and fertiliser forms being either Urea or Nitrolime. Summer months were not included as there were concerns over potential issues with variable sward composition.
Only first cut response is investigated in this study because at the first cut the effects of N application are clearer and any effects of meteorological data should be more readily quantifiable. Using later cuts introduces ambiguity as to the effective rate of N, since the amount of N left for subsequent cuts is influenced by how much is used at the first cut. This leads to complications beyond the scope of this study.
The choice of unit N as the response measure (i.e. kg DM per day /kg N applied for 50 kg N/ha) was favoured because it can be thought of as a stable entity, whereas a measure such as % N response is often greatly influenced by a small denominator, which typically occurs at times of poor growth.
The database lists some very low control yields. This leads to many extreme outliers and generally increased variability. Therefore medians are presented in the tables in preference to means as they are more stable in the presence of outliers. The tables provided give a summary of responses. The investigation of the effects of weather data on response exclusively uses unit N.
1. Database: Summary of findings
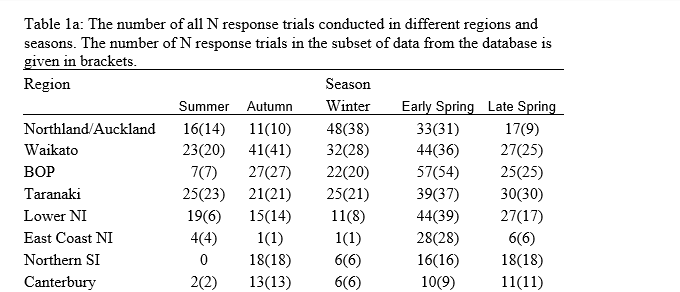
Table 1a presents the number of N response trials conducted in different regions. All trials within the database are included. A quarter of all trials were in the south of the South Island while approximately 65% were around the North Island. Given in brackets in Table 1a is the number of N response trials in the selected subset of trials. These trials were selected only when control yields < 5000 kg DM/ha, days of growth ≤ 100, and where the N fertilisers Nitrolime and Urea were used. This represented 85% of the total trial dataset (15% of trials were eliminated).

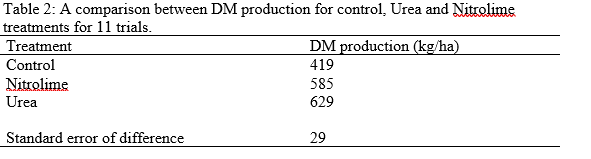
2. Comparison between different forms of N (Urea and Nitrolime) A comparison between N responses for products Nitrolime and Urea was made. A meta-analysis for the period 1969 to 1975 (O’Connor, 1982), when virtually all the Nitrolime trials were conducted, showed that there was no significant difference, on average, between the products Urea and Nitrolime (Unit N was 0.173 vs 0.217, s.e.d.= 0.045). The early literature supports the view that there is little difference in overall performance between the two products (Walker et.al., 1953). There were 11 trials in which both Urea and Nitrolime were applied in the winter/early spring months of July, August and September. For the 11 trials, the yield from the Urea treatment exceeded that of the Nitrolime in nine trials, were similar in one trial, and in one other, the yield of the Nitrolime treatment exceeded that of the Urea. An analysis of the dry matter data (DM) production for the treatments from these trials is presented in Table 2. This effect may be due to leaching of nitrate present in Nitrolime, since most leaching occurs during this period of the year.
3. Prediction of N responses in relation to climatic and pasture growth factors
Relationship between Unit N and Pasture growth rate
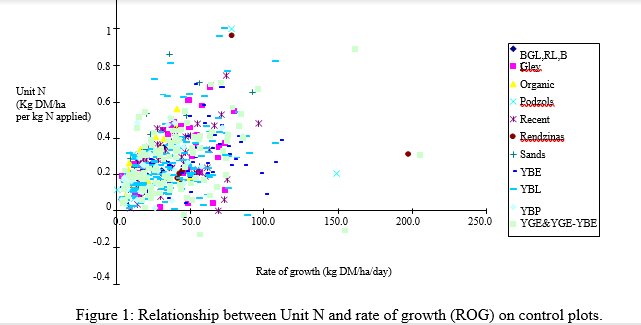
As the rate of pasture growth increases, the requirement for N increases, and the response to applied N can also increase. O’Connor (1982) showed that response to N using 25 kg N/ha was correlated with the daily pasture growth rate. This is confirmed using the data from the database (Figure 1) but with considerable scatter. Statistical analysis suggests that the relationship was soil-type dependent. This relationship passes through the origin and therefore clearly shows that there will be no response to N unless pasture is growing at that time. If pasture is growing, then the response to N is quite variable, and this will be due to numerous factors, including soil fertility, sward composition, and the weather.
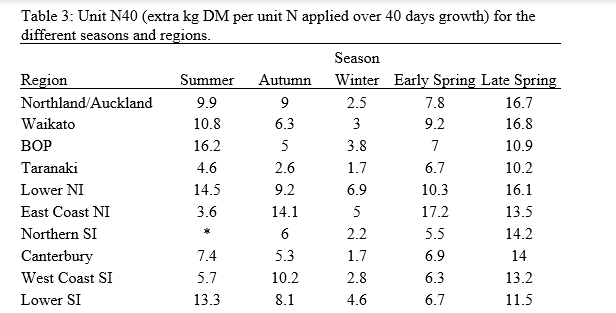
Late spring gave the greatest and most reliable responses to N application. Table 3 presents unit N40 (extra kg DM per unit N applied over 40 days growth) for all trial sites for Summer, Autumn, Winter and early and late Spring. The data were restricted to control yields< 5,000 kg DM/ha, days of growth ≤ 100, and where either N fertilisers Nitrolime or Urea were used. In late spring, maximum pasture responses to N fertiliser were obtained when temperature was around optimum and soil moisture was not limiting pasture growth. The variation in climatic conditions and no doubt other possibly undocumented effects as well from region to region resulted in smaller and less reliable responses in the other seasons. O’Connor (1982) also found spring to give the most consistent responses to N application. He classified regions as low-, moderate- or highly-responsive according to N responses using 25 kg N/ha applied treatments for his set of trials.
Relationship between Unit N and climatic factors (all data excluding Summer)
All data from the database were used except for trial data from summer months. There was no sward composition data in the database so the summer month trials were excluded due to concerns over possible sward composition issues.
A poor relationship was found between unit N and climatic factors when all trial data was used. This may be due to limiting factors, such as soil fertility, soil moisture and pasture species preventing observation of the potential N response. By way of example, poor soil fertility preventable by basal application of P, K and S may be a contributor.
The relationships between the response to N (Unit N) and the average daily air temperature and rainfall, on a soil-type basis, showed that there is little evidence of a relationship between unit N and the average daily temperature or average daily rainfall for the different soil types. All data from the database were used in these analyses except for trials with N applied in summer months.
Relationship between Unit N and climatic factors (Spring only)
When all data from the database were used except for trial data from summer months, no clear relationship between climatic factors and unit N was established. Here, only trials conducted in the spring months are used in an endeavour to establish better relationships. In the following sections, in order to establish clear relationships between climatic factors and unit N, trial data are systematically selected, e.g. spring data only, spring data where trials received basal fertilizer
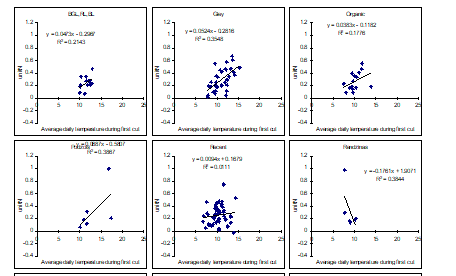
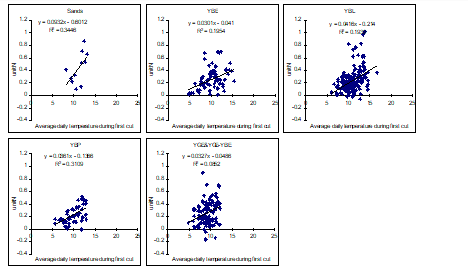
Figure 2: Relationship between Unit N and average daily temperature. Only Spring data used (Aug – Nov).
The relationship between N response and temperature is improved when the data are limited to only the spring period. In spring, soil moisture is not limiting pasture growth and the temperature effects are clearer. The relationship between the response to N (initial harvest after N application) and the average daily air temperature during the period August to November is presented in Figure 2 on a soil-type basis. The trends are similar for all soils except for the Rendzinas where the data are very weak and the relationship is not significant. There were very few trials conducted on this soil so the data are less reliable
The relationship between N response and the average daily rainfall was found to be poor when the data are limited to the spring period (August to November). At this time of the year, soil moisture is often not limiting and therefore no trend was established between unit N and average daily rainfall for trials conducted in the spring months.
Relationship between Unit N, climatic factors and applied basal fertiliser.
The application of basal fertiliser ensures nutrient deficiencies other than N are non-limiting. Only data selected from trials that used basal fertiliser were used to see if the relationship between unit N and climatic factors could be improved. Figure 3 presents the relationship between response and average daily temperature, for each soil, under near-ideal conditions (average daily rainfall ≥ 1 mm and soil deficit ≤ 20 mm).
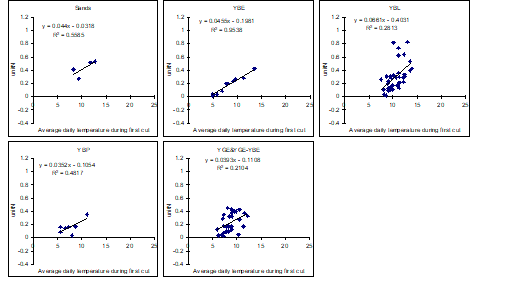
Figure 3: Relationship between unit N and average daily temperature for Spring data (Aug – Nov) with only those trials having P, K and S basal dressings. Data only included sites with average daily rainfall ≥ 1 mm and soil moisture deficit ≤ 20 mm
The pasture yield responses to fertiliser N can be limited by deficiencies of particular nutrients such as P, K and S. All trials used in this graph had basal dressings of P, K, and S applied, and data were restricted to adequate moisture levels where pasture growth would not be reduced. Thus the lines produced are almost certainly the best-case scenarios for the effect of temperature on N response. Consequently, the lines fitted should be the maximum slopes possible. This approach greatly restricts the amount of usable trials, and there are insufficient data for some soils to get a reliable regression. Many of the graphs have no temperature data low enough to provide an adequate range to show a clear response curve. This was alluded to earlier in the paper as a likely feature of this type of data (trials were mostly conducted in conditions suitable for growth). The sedimentary soils (Gley, YGE and YGE-YBE intergrades) tended to have more variability in their relationship. This might reflect the much wider range of conditions applicable to these soils compared to most other soil groups. They ranged from potentially quite responsive to non-responsive.
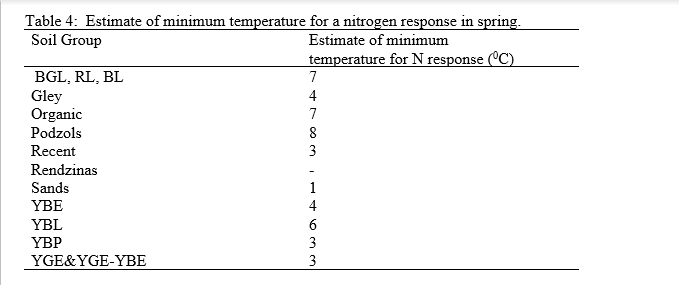
Table 4 shows the estimate of the minimum temperature for a nitrogen response for each of the soil types in Figure 4, and is based purely on the intercept of the x axis from the linear regression. Given the variability of the data, and the level of extrapolation needed in some soils, these estimates should be viewed as ‘indicative’. The mean minimum air temperature over all soils, ignoring the reliability of the estimates, is approximately 5 0C. N response studies with long-term pasture receiving fertiliser N in early spring indicated that no growth occurred when soil temperature at 10 cm was < 5 0C (Whitehead 1995). Forty-two N response trials conducted around NZ in 2005 showed the minimum soil temperature (10 cm depth) needed for N response was 5 0C (Rajendram, unpublished data). The mean minimum daily air temperature over all soils in this study is in the order of 5 0C.
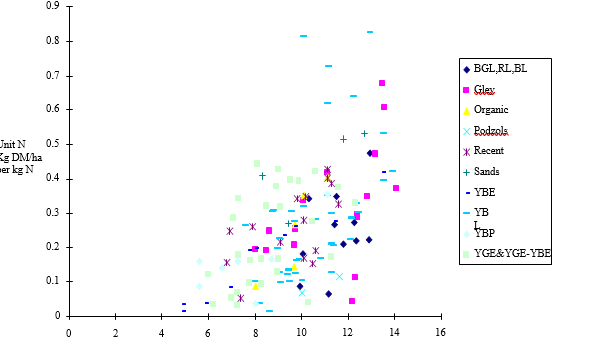
Relationship between Unit N and temperature where basal fertiliser was applied. The relationship between N response and average daily air temperature under near-ideal conditions is shown in Figure 4, where all data are plotted on the same graph and labelled by soil type. Statistical analysis of the relationships showed a common slope and intercept for all soil types in this dataset, but, given the paucity of data for
some soil types under this strict set of restrictions (there are no data for some soils), it might be dangerous to assume this result is universal.
The overall regression is:
Unit N = –0.1689 + 0.04336 x mean daily temperature
This relationship holds under ‘ideal’ conditions, and is where there are no possible limitations to growth (other than N). The predictions, given the restrictions on the data, are likely to be the maximum response rate for this scenario (or very close to it). Further studies will need to be carried out to verify these results.
.
Figure 4: Relationship for all soil groups between Unit N and average daily air temperature.
Relationship between Unit N and climatic factors (Autumn)
The relationship between the response and meteorological data for the autumn months (March – May) using all available data showed little evidence of any consistent relationships between unit N and climatic factors for the 212 trials conducted during this period. The relationship between response and climate is variable from site-to-site in the autumn months, and, consequently, no clear relationship was established. Restricting the data to those trials which have basal fertiliser applied did not improve the relationships.
Relationship between Unit N and temperature on a Region basis (Spring trials) The relationship between unit N and climatic data for different regions (rather than soil group) was explored. The relationship between N response and temperature data
for different regions is presented in Figure 5. There were strong links established between temperature (but not for rainfall) and spring responses for each region. This was consistent with findings for spring responses when looked at on a soil basis – which is a reflection that soils broadly differ around regions.
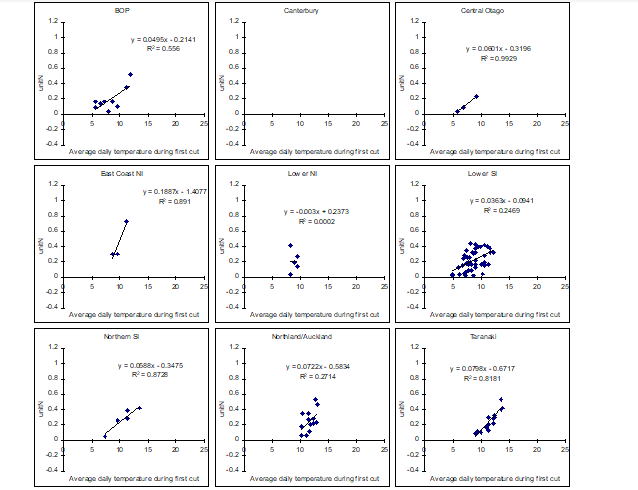
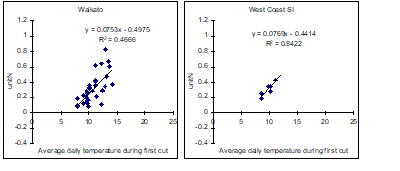
Figure 5: N response and temperature data for different districts in spring for sites with average rainfall ≥1 and deficit at start ≤20, control yields<5000 DM/ha, and days of growth <100 days.
Conclusions A total of 1,272 N response trials were conducted over an 80-year period in NZ, which have been incorporated into the database. About50% of the trials used a basal dressing and so nearly halfve of the trials did not ensure other elements were not limiting. Most of the trials either used Nitrolime or Urea as the N fertiliser. Nitrolime was used prior to 1975, whereas Urea has been the favoured N fertiliser due to cost and availability since then. A comparison between N responses for products Nitrolime and Urea showed no significant overall difference between these two fertiliser products.
For this paper, trials conducted after 1951 (56-year period) were used to establish relationship between climatic factors and response to N. The study found that late spring gave the greatest and most reliable responses to N application.
In general, only weak relationships between climatic factors and response to N were established. The strongest relationship was found to be between response and average daily air temperature for each soil, but under near-ideal conditions (average daily rainfall ≥ 1mm and soil water deficit ≤ 20 mm) and where basal fertiliser had been applied to trials. The relationship between N response and rainfall was weaker than the relationship between N response and temperature. If the data were available, better relationships may have been established if soil moisture, rather than average daily rainfall, was used. Many of the trials were a large distance from the nearest meteorological station and this would have detracted from establishing good correlations. If N status data were available, it may have explained some of the variability encountered from the data.
An estimate of minimum temperature for a nitrogen response in spring was established as 5 0C and is consistent with overseas studies. This suggests that fertiliser should not be applied until the mean daily air temperature is > 5 0C.
From the data to date no single relationship has explained N response. Some of the factors which have been important , are temperature, soil type, soil moisture and basal fertility. Therefore a fertiliser decision support system needs to take account of all these factors. Other factors, such as pasture composition or soil N status, may have a greater effect on N response, but these were measured at few sites and so their influence could not be reliably determined. This project has been useful for collating a large number of N response trials, which now represents a valuable resource for use in the future.
Cornforth, I.S., Sinclair, A.G. 1982: Fertiliser recommendations for pasture and crops in New Zealand. MAF.
Crush J.F., Ledgard S.F., O’Connor M.B. and Roberts A.H. 1994. AgFacts. Nitrogen fertiliser for pasture. Printed by AgResearch.
Ledgard, 1990’s. Nitrogen fertiliser use on pastures and crops. Edited by S.F. Ledgard.
Lynch, P.B. 1966: Conduct of field experiments. Bulletin No.399. New Zealand Department of Agriculture.
O’Connor. 1982. Nitrogen in fertilisers in NZ agriculture. Edited by P.B . Lynch. P65-76.
Roberts, A. H. C and Morton, J. D. 1993. Fertiliser use on New Zealand Dairy and Sheep/Beef Farms. Published by N.Z fertiliser Manufactures Association.
Walker, T.W., Adams, A.F.R and Orchiston, H.D. 1953. The use of fertilisers on herbage cut for conservation. Part IV. J. Grasslands Society. 281-299.
Whitehead D.C. 1995. Grassland Nitrogen. Published by CAB international, wallington, U.K.